Despite the explosion in protein structural and functional data, our understanding of protein and movement is still very limited. Experimental methods cannot operate at the time scales necessary to record protein folding and motions, and traditional simulation techniques such as molecular dynamics and Monte Carlo methods are too computationally expensive to simulate long enough time periods for anything other than small peptide fragments. However, it is critical that we better understand protein motion and the folding process for several reasons: understanding the folding process can give insight into how to develop better structure prediction algorithms, treatments for diseases such as Alzheimer’s and Mad Cow disease can be found by studying protein misfolding, and many biochemical processes are regulated by protein motion.
Our technique for computing protein folding pathways and protein motions is based on the successful probabilistic roadmap (PRM) method for robotics motion planning. We were inspired to apply PRMs to protein folding based on our success in applying it to paper folding.
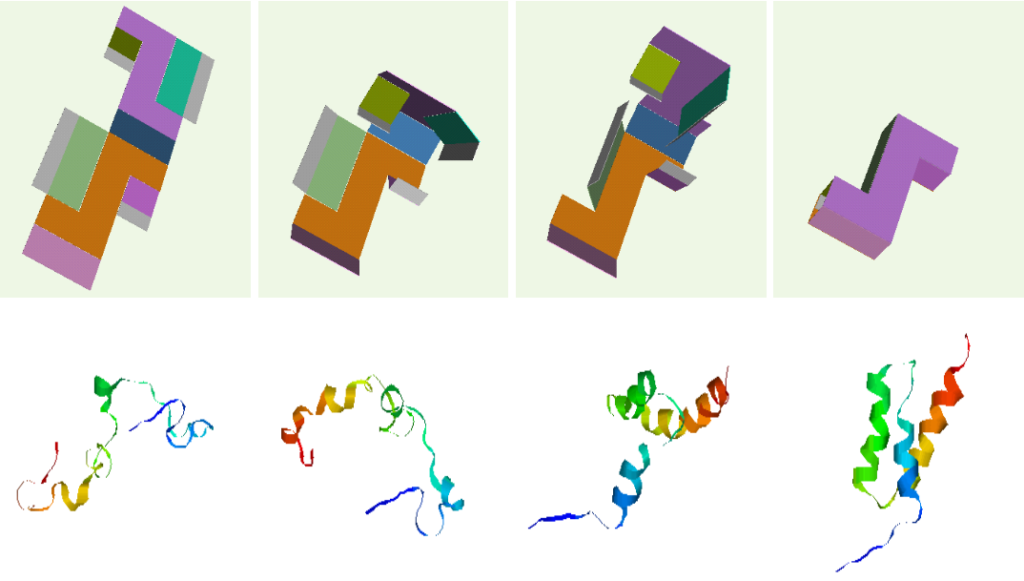
Parallel between box folding and protein folding.
We have obtained promising results for several small proteins (about 60-100 amino acids), and we have validated our pathways by comparing their secondary structure formation order with known experimental results, examining folding rate, and studying population kinetics. A major feature of our technique is that it produces many folding pathways in just a few hours on a desktop PC. These pathways provide global information about the protein’s energy landscape.
Secondary Structure Formation Order Analysis
In order to study larger proteins and more challenging protein motion problems, we applied rigidity analysis to bias our sampling in a more physically realistic way. Given a protein structure, we use rigidity analysis to identify the rigid and flexible components of the protein. We sample the flexible regions with a high probability and sample the rigid regions with low probability. We then performed a detailed study of protein G (streptococcal protein G, B1 immunoglobulin-binding domain), protein L (peptostreptococcal protein L, B1 immunoglobulin-binding domain), and two mutated forms of protein G, NuG1 and NuG2, to further validate our technique. These proteins provide a good test case for out technique because they are known to fold differently even though they have similar structure:
-

- Protein G
-

- Protein L
-
- NuG1 – mutated residues from protein G in wireframe
-

- NuG2 – mutated residues from protein G in wireframe
All four proteins are composed of an alpha-helix (green) and two beta-hairpin 1 (orange) and hairpin 2 (blue). Native state exchange experiments, pulse labeling/competition experiments, and phi-value analysis indicate that hairpin 1 forms first in protein L and hairpin 2 forms first in protein G. Protein G was then mutated by submitting a few residues in hairpin 2 to decrease its relative stability. Phi-value analysis indicates that the mutations switch the hairpin formation order from the wildtype to that of the protein L. We were able to successfully replicate these results with out technique. For each protein, we analyzed hundreds of folding pathways. The following table shows out simulation results:
Comparison of secondary structure formation order for proteins G, L, NuG1, and NuG2 with experimental results.
In addition to detecting the correct folding behavior of each protein, our rigidity-based technique can also help explain the stability shift in NuG1 and NuG2 from the wildtype. In all four proteins, the central alpha-helix remains completely rigid, as expected. We also increased rigidity from our protein G to NuG1 and NuG2 in hairpin 1 as suggested by experiment. For the other regions, the rigidity shows more similarity between the mutated forms of protein G and protein L than with protein G, reflecting the similarity/difference in folding behaviors.
Population Kinetics and Folding Rate Analysis
Our roadmaps provide an approximate view of a protein’s folding landscape. In our recent work, we have explored various methodologies for studying the kinetics of protein folding in these approximate models. Our two methodologies, map-based Master Equation (MME) and map-based Monte Carlo (MMC), allow us to study two important features of protein folding kinetics: relative folding rate and population kinetics. While master equation calculation and Monte Carlo simulation have been performed on protein models before, their computational cost have prohibited them from being used for large protein models. Our map-based approximation approach enables us to study the kinetics of much larger proteins than can be handled by traditional master equation solution or Monte Carlo simulation.
We can use the MME approach to study relative folding rate as extracted from our roadmaps. For this study, we looked at Protein G and its variants NuG1 and NuG2. Experimental studies have shown that these two mutants folds 100 times faster than protein G.
We applied the MME approach to study the relative folding rates of these proteins. The simulated folding rates are shown below for Protein G and its mutants NuG1 and NuG2. The plotted eigenvalues were calculated using MME. Note that the small non-zero eigenvalues correspond to the folding rate (index 2). Our simulations show that Protein G folds much slower than its mutants NuG1 and NuG2, agreeing with lab experiments.

We also see the performance of MME roadmaps ranging in size from 2000 to 15000 nodes. The running time of MME scales linearly with roadmap size (i.e. the size of the landscape model).
Acyl-coenzyme A Binding Protein (ACBP), is and 86 residue protein with five helices and two tryptophans in the core of the protein. The folding of ACBP has been studied in the lab through tryptophan fluorescence, and it has been shown that it has a fast, two-state folder.
-

- Population kinetics
-

- Tryptophan contact formation
-

- Helix formation
From our MMC kinetics, we see that ACBP exhibits a property similar to other all alpha proteins we have studied: continual formation of helix contacts and reaching the native state after the formation of many helix contacts. Also, since ACBP has two tryptophans in the core of the protein, we see a quick increase in the formation of these contacts around the same time we see the native state beginning to be populated, around time step 100. This could correspond to the packing of the structure and the formation of long-range interactions in the core of the protein. We also show this protein has similar kinetics to other all alpha-proteins and other lab experiments on alpha proteins. Through the technique we have been able to study population kinetics for proteins of various lengths and mixed structures.
Exchange Rate Analysis and Folding Core Identification
We have also used our roadmaps, or approximate landscape models, to simulate relative hydrogen exchange rates and infer the folding core. The folding core is the set of residues that are the first to form structure during folding and the last to lose structure during denaturation. One of the most prevalent experimental methods to infer the folding core is hydrogen exchange. It measures the rate at which residues exchange their hydrogens for Deuterium during either folding or unfolding.
-

- Continuous Labeling EX [Hilton78]
-
- Continuous Labeling EX [Richarz79]
-
- Pulse Labeling EX [Roder 86]
We use rigidity analysis to examine the folding pathways on our roadmaps (typically extracted by MMC) and compute an approximate exchange rate for each residue. We developed two approaches for approximating exchange: one looks at the individual residue’s rigidity/flexibility and one looks at the formation of mutually rigid, non-local subsequences. We found good correlation between the residues identified experimentally as part of the folding core and residues we identify with slow exchange rates:
-

- Simulated Relative EX (by rigidity/flexibility)
-

- Simulated Relative EX (by mutually rigid subsequences)